
This week we have released our biggest user interface update yet. Needless to say we’re super excited and really hope you will love it as much as we do. We’ve made a number of changes to make Roll even more intuitive and added a bunch of cool new charts and graphs to give you even better visibility of your projects and business.
Read about all the changes and additions below. Or even better, log in to Roll now to see for yourself.
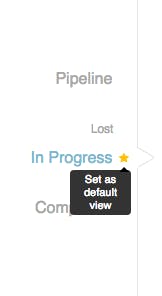
1. 'Set as default view'
We now have the 'Set as default view' on the sidebar navigation links for projects and invoices. This controls what page you will land on when you click the 'Projects' or 'Invoices' main links.
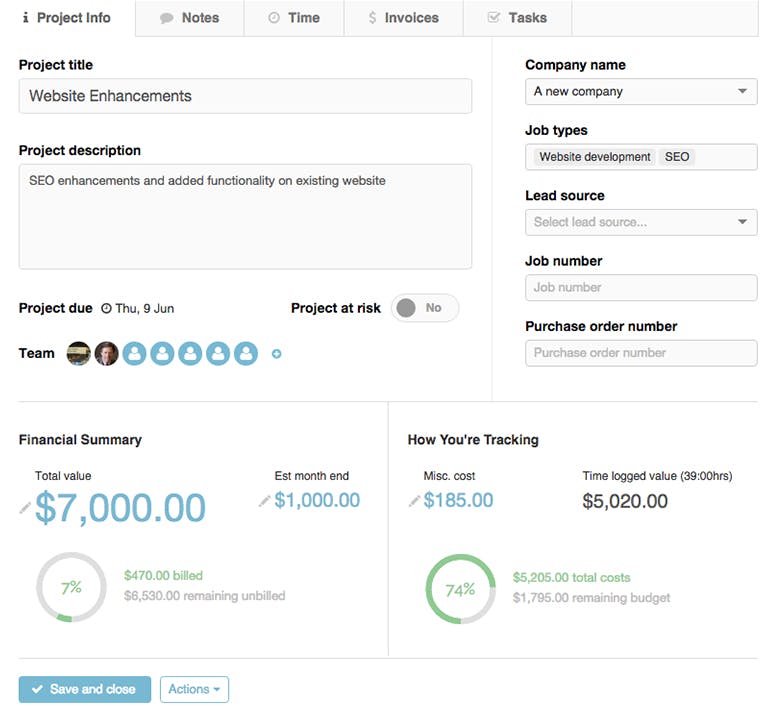
2. New and improved project view
We have moved all the tabs (notes, time, invoices & tasks) to the top of the screen when viewing a project. The information that was above the tabs is now in a new tab called 'Project Info'.
A few items have moved around a bit (eg: job types and lead source is now in the right column) but it’s all super intuitive so you should have no problem finding anything.
Based on frequent requests from you, our users, we’ve added a new field: 'Job number'.
We’ve added a couple of charts to make information more visible and easier to digest
- Financial summary chart: This visually portrays the amount that has been billed out of the total project value
- How you're tracking chart: This graph gives a representation of how much of the value of the project you have used, calculating the costs accrued through your time that you have logged and the hourly rates against them, also adding any miscellaneous cost entered. This can give a very different picture to the financial summary, as you might be heading toward the end of your budget time wise, but have only billed 20%. So now you can see 'how you're tracking' within the project budget.
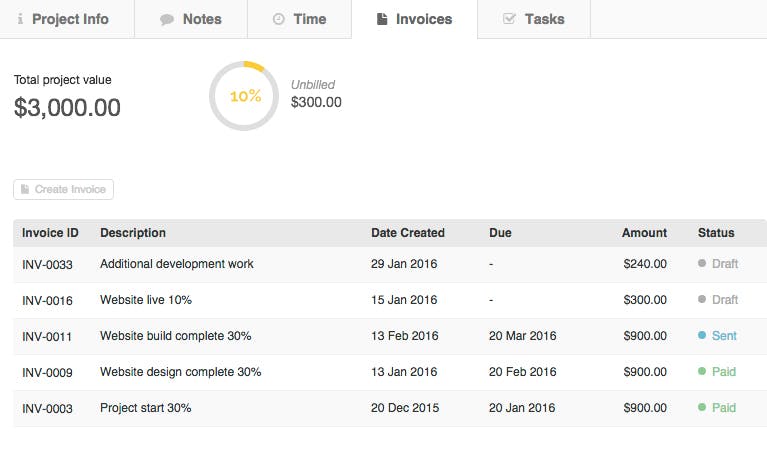
3. Better visibility of your financial situation
If you have switched on our new invoicing feature (you can do so under settings), you will now see key stats at the top of the invoices tab, in the project view: What is unbilled, awaiting payment, and in draft.
4. Even more visibility on where each project is at
A new billed progress bar in the project row on the project page now gives you a quick overview of how much you have billed for each project that is in the 'In Progress' and 'Completed' stage. Great visibility for project mangers.
